The analyzed data was pulled using CTA’s Bus Tracker API for the month of May 2018. All trips were analyzed between 6 a.m. and 6 p.m. The month of May was selected since it presents few holidays and usually offers mild weather, which minimizes service disruptions. Speed, bus bunching and typical wait time were the metrics used to analyze speed and reliability of bus service in Chicago.
Speed is calculated using the average distance (meters) and average time travel (seconds) for every stop by route from 6 a.m. to 6 p.m. This data was then filtered and organized by ward and route to find the average distance and average travel time for every segment of a route that runs through a ward. The average speed of a ward was then found by adding the distance (meters) and the travel time (seconds) of all the routes that run through it and then dividing the total distance by the travel time and multiplying by 2.24.
Reliability:
- Bunching is defined as the percentage of Key Route buses, as defined by the CTA’s Key Route service standards, that arrive at less than 25 percent of the scheduled interval behind the previous bus. So, if bus #2 is scheduled to arrive eight minutes after bus #1, but instead bus #2 arrives less than two minutes after bus #1, then bus #2 is considered “bunched.” The developer calculated expected headways given the time of day, as the data did not provide a direct comparison between observed and scheduled trips. Bunching data was calculated only for high frequency routes, as defined by CTA’s Key Route service standards, for weekdays between 6 a.m. and 6 p.m.
- Typical Wait Time is defined as how many minutes people are waiting at bus stops within in the ward beyond what the schedule states. Typical Wait Time was calculated for low frequency routes within wards, in other wards bus routes not listed on the Key Routes service standard index provided by CTA, for weekdays between 6 a.m. and 6 p.m.
Ridership data was provided by CTA and is defined by the number of people boarding at stops that fall within each ward for weekdays in May 2018 between 6 a.m. 6 p.m. This data allowed us to calculate the total number of people boarding buses within the wards, the three highest ridership routes in each ward and the number of bus lines that run through each ward.
Ward and route maps were created in ArcGIS by Esther Ramsay, Active Trans Bus Advocacy Intern, using the following data sources: Esri Basemaps: Esri Major Streets (2011): Chicago Data Portal, Bus Routes (2018): Chicago Transit Authority and Chicago Data Portal, Ward Boundaries (2015): Chicago Data Portal, and Waterways (2018): Chicago Data Portal.
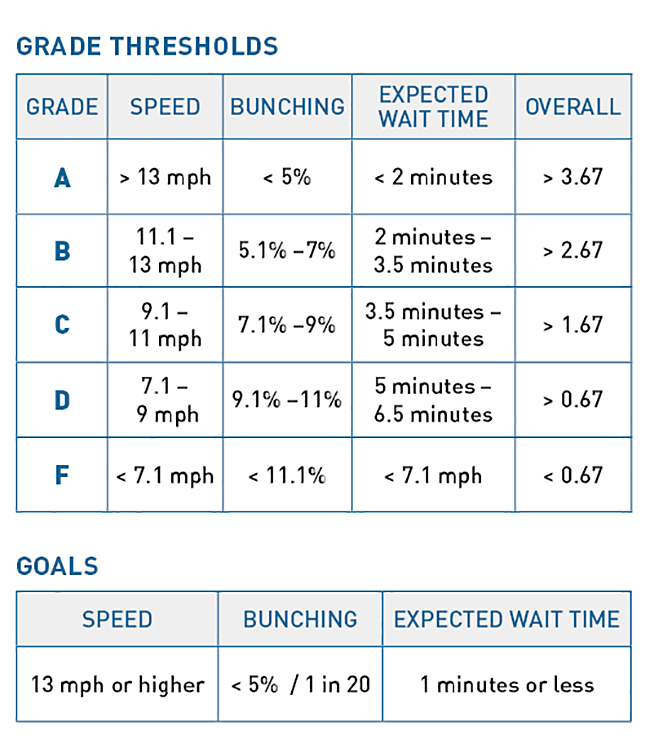
Each ward in the city of Chicago and select high ridership routes were assigned speed and reliability grades based on the thresholds in the table below. The reliability grades of bunching and typical wait time were averaged into one overall reliability grade for each ward using the ratio of the number of high frequency to low frequency stops within the ward. Next, the overall reliability grade and the speed grade were then assigned to a traditional 4-point scale and averaged to create the route’s final overall grade, per the table below.
We have strived to fairly grade CTA buses by holding them accountable to a high but achievable standard that acknowledges the constraints on bus operations in a dense, metropolitan city. In other words, we are not grading on a curve. Active Trans’ approach to defining the above grade thresholds is as follows:
- We set a goal of increasing speed to a median of 13 mph. The current median speed among Chicago bus routes is 9.1 mph.
- We set a goal of reducing bunching on high-frequency routes to 5 percent, which would represent 1 in 20 buses bunched. Current median bunching among Chicago wards is 11 percent.
- We set a goal of typical wait time of one minute or less beyond what the schedule states.
We have defined grade thresholds in relation to these goals and to the current statistical distribution of performance recognizing that, no matter what, some wards and routes will perform better than others. For speed and bunching, we used increments of two to define the grading thresholds, but there were smaller deviations for additional expected wait time.
Chicago’s Bus Friendly Streets Report Cards performance metrics are available and documented as part of a public API and related analysis code, both of which are available for anyone to review, use and adapt on GitHub. Active Trans owes special thanks to TransitCenter for providing funding and support throughout the production of the report cards. In addition, special thanks goes to Neil Freeman for producing the code and analysis. Thanks to Active Trans Bus Advocacy Intern Esther Ramsay for creating the maps and analyzing the data. We would also like to thank Leah Mooney, Jennifer Henry and Emily Drexler of the Chicago Transit Authority (CTA) and Luann Hamilton, Jeffrey Sriver and Jason Biernat of the Chicago Department of Transportation (CDOT) for providing their feedback on draft versions of the report cards. And last but not least, thanks to Michael DiGioia and others at Media Made Great who created the interactive map and the online presentation of the report card data.
Email us with questions about the methodology: [email protected].